The agent that is the leader in failures is not always the worst in the operation, in some cases, it may be that the oldest agents lead the number of failures by the number of times they were evaluated. For this reason, we added a new column called “Representation” in the Training Need Report.
The goal on this column is to show the agent that failed the most in relation to the number of times they were evaluated, providing a percentage view that is much more faithful to the real scenario of their training needs.
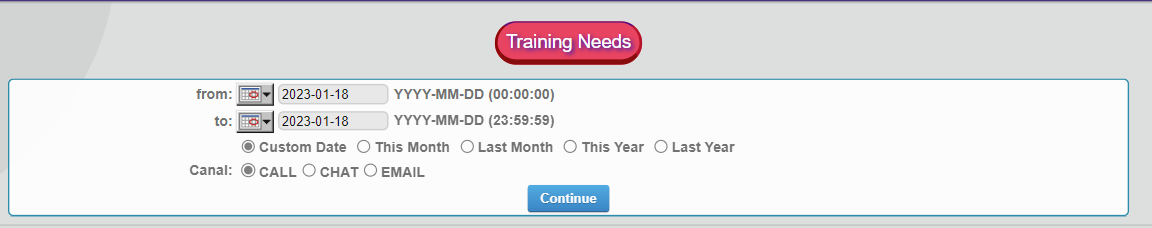
To access this update, follow these steps: Productivity/Training Needs

You can filter by date and service channel:
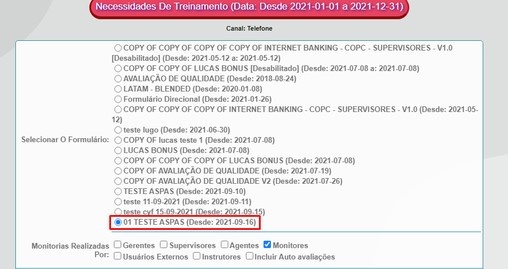
Next, choose the form you want to filter:
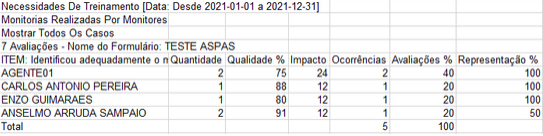
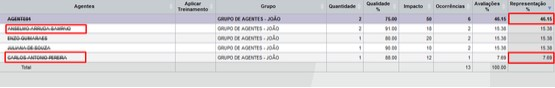
The report now has the column “Representation”:
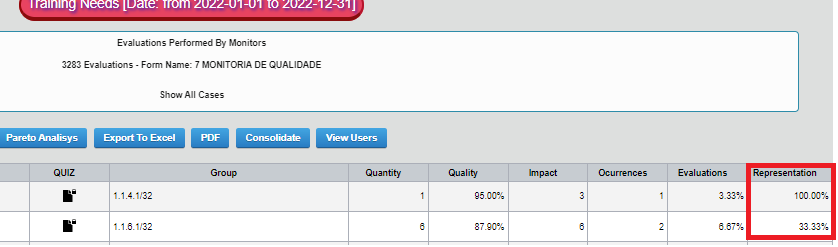
An example of this new feature:
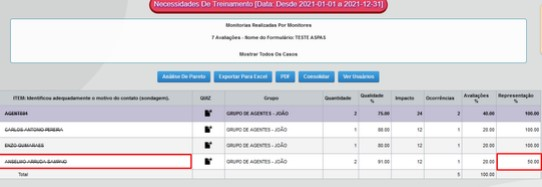
In the case of the agent ANSELMO ARRUDA SAMPAIO, it had 1 occurrence in the period in which it was evaluated 2 times, therefore, it represented 50.00%.
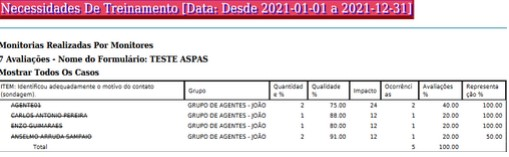
When exporting to Excel or PDF, the data appears ordered with the “Representation” filter, filtering from highest to lowest percentage.
EXCEL::
PDF:
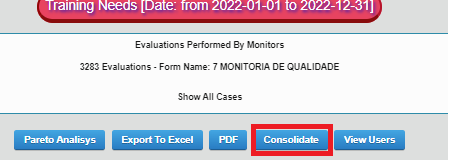
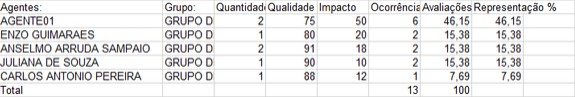
After clicking the “Consolidate” button
The data in the “Representation” column makes another type of calculation, takes the number of occurrences in relation to the number of items, in the example below, there were 13 items.
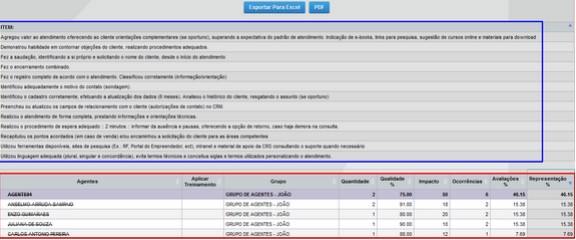
According to the example:
Agent 01: There were 6 occurrences in the period 6/13×100 = 46.15
Antonio Gomes: There was 1 occurrence in the period 1/13×100 =7.69
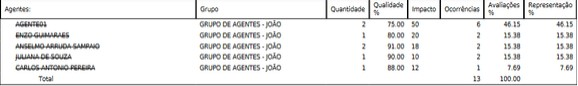
When exporting to Excel and PDF, the data appears ordered with the “Representation” filter, from highest to lowest percentage.
EXCEL:
PDF:
If you have suggestions to improve our system, we are open to receive them.
CYF team.