It’s now much easier to track the indicators that truly matter for your operation.
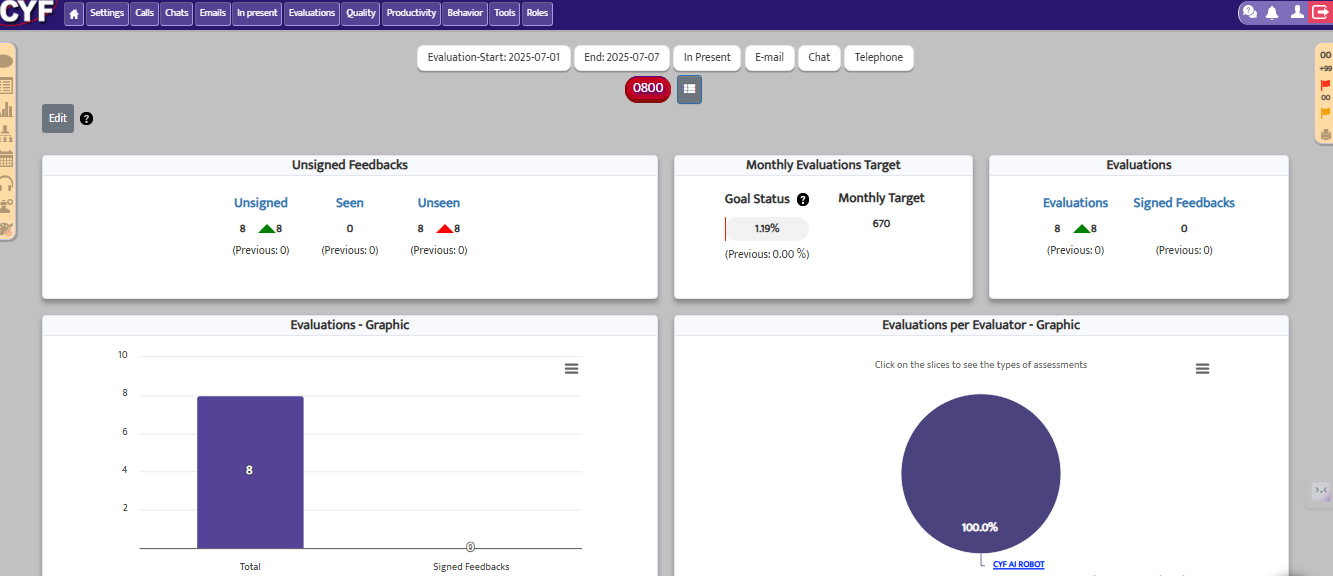
With the new CYF Quality homepage, you can gather all your charts and metrics from the Evaluation, Quality, and Productivity categories in one place, with full flexibility to organize them your way.
Easily customize your own dashboard
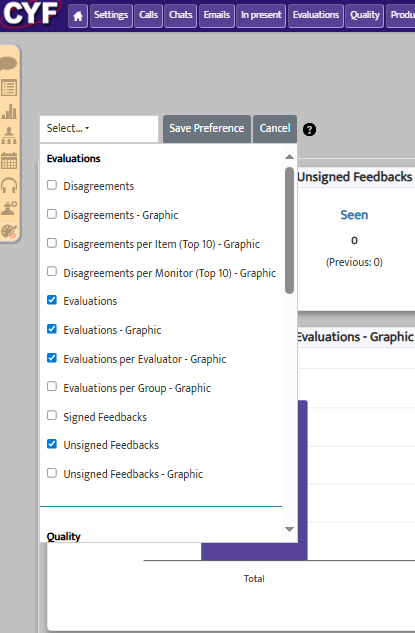
By clicking the “Edit” button, you’ll see all available indicators to build your personalized dashboard.
Simply select the desired charts, organize them the way you want, and then click “Save preference”.
The system will automatically update your panel based on this setup.
Each user can:
✅ Choose which charts to view
✅ Resize and rearrange blocks as preferred
✅ Save their layout as a personal preference
All within a light, modern, and intuitive interface — perfect for those who need quick insights and data-driven decisions.
📊 Available indicators on the dashboard
The panel displays the same data as traditional reports shown in the image above, with full flexibility to combine them as you wish:
- Monthly goals
- Average contact time (productivity)
- Monitoring time
- Evaluation averages and KPIs
- Among other strategic indicators
You can navigate between categories, apply filters, and view data in real time, according to your operational needs.
🔍 Smart filters
By clicking on “Filters”, the tool offers the familiar filtering options:
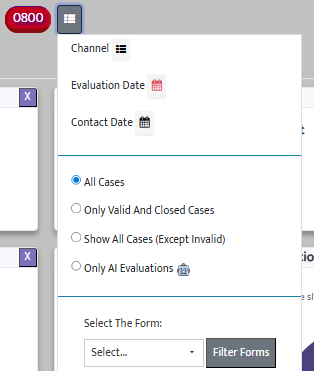
- Channel
- Evaluation date
- Contact date
You can also select the form to be filtered.
Important: filters are not saved as preferences. The system will always display data from the current day by default, ensuring an up-to-date view.
👥 Layout optimized by user profile
Each user type (such as managers, coordinators, etc.) starts with a default chart selection designed for the specific needs of that role. Of course, everything can be adjusted based on each user’s preferences.
What are the benefits of the new dashboard?
🔹 Save time with ready-made dashboards and build your own version.
🔹 View everything you need in one place.
🔹 Make decisions based on real-time, accurate data.
🔹 Gain autonomy and agility in monitoring your operation.
💡 Ready to use!
The new dashboard is already available in the system. Simply log in, personalize your panel, and save your preferences.
If you need support, our team is ready to help!