
All areas of a call center must be analyzed, from the efficiency of human resources to the efficiency of the sales area, and the quality is no different. In this article, you will see the 11 Call Center Quality Assurance Metrics that you should follow as they will also directly or indirectly affect performance and costs.
It is important to know that in the area of quality monitoring there are different categories of metrics and here you will know the following:
Contents
Critical faults evaluations. 3
Efficiency of quality processes 4
Signed and unsigned feedbacks 4
Quantity of contested feedbacks 5
Correct vs incorrect contestations 5
Quality metrics
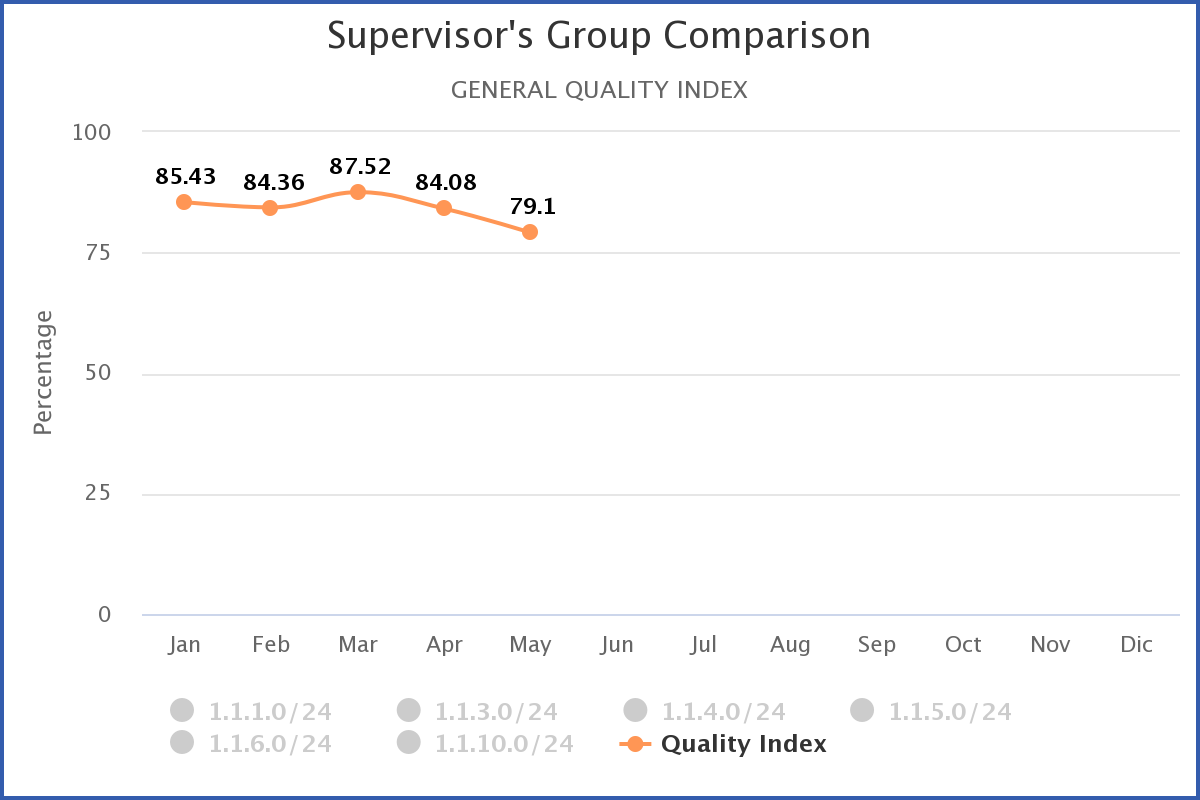
Quality index
The quality index is one of those metrics that everyone uses and knows, but it is always important to mention that in addition to just measuring the index, it is essential that the quality team use the date of the customer service, because the evaluation date is used for others purposes such as productivity, delay in the application of feedback, etc.
Another important point is to make the comparison between:
Teams
When comparing teams, it is much easier to know which teams and leaders stand out the longest, and when a team stands out, study why this is happening. Good teams usually have good leaders, don’t forget that.
Customer service channels
The same strategy should also be used to compare the quality index between the different customer service channels, see if there is any noticeable difference in quality between the channels … If this is happening, it may be the case to move good operators to service channels with a low quality index and see if the problem is actually in the human part, obviously since they have the necessary skills to serve this other type of channel.
By monitor
The quality index is used to measure the quality of customer service, but this comparison between monitors will allow us to verify the alignment that exists between them, as long as they monitor the same processes and the same equipment.
Imagine the following scenario:
• Monitor A and monitor B, evaluate the same service channel in the same operation …
Scenario 1: If there is a big difference between the average scores that each one gives to the agents, it means that there is a lack of alignment between them.
Scenario 2: On the other hand, if the scores are very close, it means that the evaluation form is aligned.
Faults report
The purpose of faults report is very simple, but at the same time, it is one of the most valuable reports.
This report will introduce you to the items that we fail most on our QA form. In order to focus our training on the main pains of our operation.
The great advantage of using the failure report within CYF Quality is that there is a metric that is the impact. The function of the impact index is simple, not always the item in which you failed the most is the one that impacts the most financially or for the image of your company, so focus first on the items that have the highest impact index.
Agents who fail the most.
Certainly in the faults report you have already identified the items that failed the most, but it does not make sense to apply training to all agents on these items … Training a person in something that they already know and master, will demotivate them with certainty, and you will continue wasting your time and your money out.
The right thing to do is to identify who are the people who fail the most in the most important items and apply specific training to them. Of course, this will take a lot of work if done manually without a system handling it.
In CYF Quality there is a specific report for this, which is “Training Needs”, and there is also a module to apply and manage this training continuously and automatically, without the need for intervention by the training team, without removing the agents from operation and without compromising your productivity.

Critical faults evaluations.
Critical faults is one of the biggest problems within a call center …
So it can’t go off your radar, if you use this type of item, make it a habit to measure the percentage of critical errors monthly and focus on reducing it month by month.
Of course, measuring is not enough if the necessary actions are not taken, which could even include taking an agent out of the operation immediately.
Quality team productivity
Evaluations per monitor
How do you monitor the productivity of your monitors?
Does it only measure the amount that each one evaluated in the month?
If so, it’s a good start, but here are some other ideas you can implement:
• See which monitors choose longer or shorter calls.
• Set a daily goal for evaluations.
And, of course, you can already do all of this at CYF Quality.
Efficiency of quality processes
Evaluations per agent.
With CYF Quality, in a few clicks, you already know which agents have already been evaluated, the number of times they are marked as a goal in the month. To do this, simply access the “Evaluation per agent” report.
On average, most of the market makes 4 evaluations per agent per month, but be careful, this does not mean that it should be this way. The goal should be established according to the difficulty and importance of the processes, the number of calls, the maximum permissible error and the confidence index.
Be careful not to limit yourself to evaluations only, as feedback and coaching are a very important part of the quality process. Monitoring is the measure of the quality index, feedback and coaching truly belong to the improvement process.
Signed and unsigned feedbacks
Do you know how many feedbacks have already been seen, signed and contested?
If not, carry out this control in order to guarantee a quick response to your operation, mainly in critical faults and also to identify which agents are most committed to quality.

Quantity of contested feedbacks
Allowing agents to disagree with evaluations is very important to create a culture of active voice for their agents, the result is clear, agents feel much more participatory and important to the company.
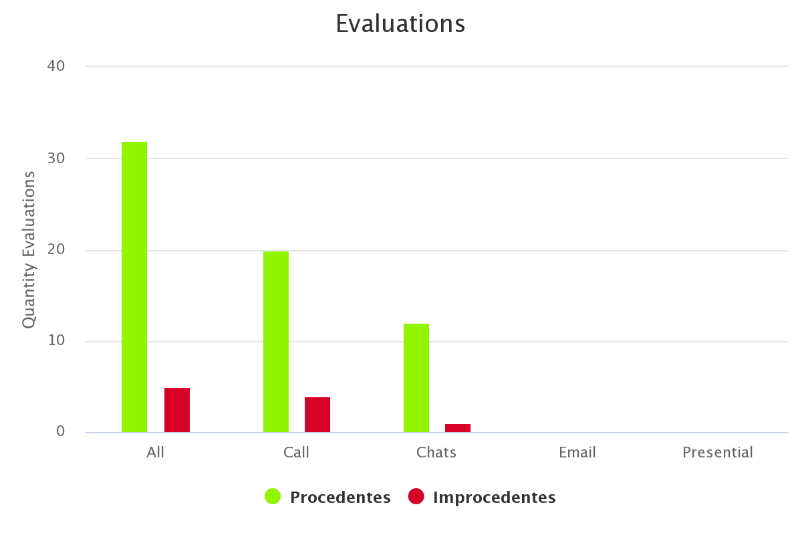
Correct vs incorrect contestations
By freeing up the possibility of disagreement, there will surely be disagreements arising, which are disputes in which the quality monitor failed at the evaluation time, not the agent. But calm down, this is absolutely normal. What is not normal is that there is a high number of correct disagreements coming. A healthy number is a maximum of 5% of the disputes that arise …
If in your current scenario, you have a much greater amount of disagreement coming from than mentioned, there is a great chance that your monitoring team is misaligned or even lacking the necessary training to conduct evaluations.
Analytical metrics
There are different ways to obtain analytical metrics, they can be from simple consultations in CRM and IVR’s and even in more sophisticated analysis using specific software for this, like CYF Analytics.
With it, you will have an instant scan of all or if you want only a percentage of your phone or chat contacts, thus resulting in various ideas and sensitive information.
Here are the main metrics to consider:

Offensive contacts
The quality standard today is to evaluate by sample, that is, 4, 5 or 6 evaluations per agent per month … A sample that can represent the scenario of all calls or chats from a call center.
But, how many problems can occur in the other calls that we do not evaluate? The possibility is enormous.
For this reason, CYF Analytics helps to detect and delegate in the quality team connections that there have been offensive or profane words and thus evaluate and take the necessary actions.
Mention to competition
The monitoring area not only lives with problems to solve, it is extremely useful to detect trends and market standards and obviously in its clients, so be attentive to calls that mention the competition or products that are not yours, they could be a big change in the philosophy of the company, and obviously put the quality area in the spotlight.
Conclusion
The quality and productivity metrics reported in this content can be extracted from evaluations carried out by Excel, but can you imagine the work and the problems that this could cause when having so much information merged into spreadsheets?
If you don’t even want to touch the spreadsheets to solve all of that, just use CYF Quality and CYF Analytics.
Any question just talk to us.