The new report was created to integrate and unify all quality information into a single document, following the same visual standard as the productivity and evaluation reports.
To access it, go to the Quality tab and select the Quality Report:
📈 Quality Report
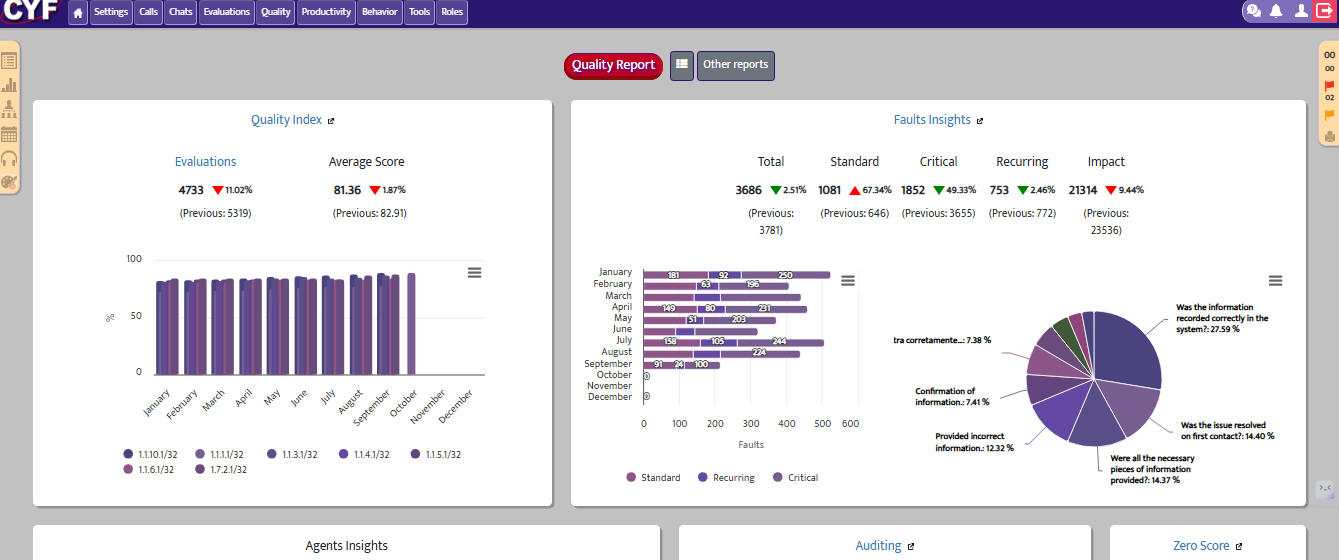
- Modern visual interface: Dynamic graphic and tables with intuitive filters.
- Supervisor view: Monthly comparison between supervisor teams.
- Period comparison: For example, when selecting 2024, the system automatically compares it with 2023.
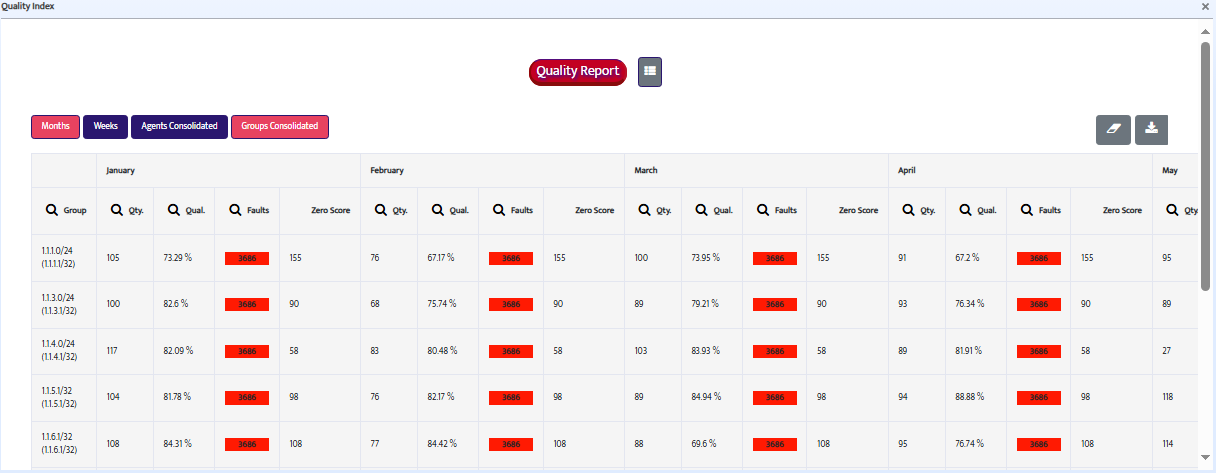
- Detailed agent table: Now displays:
- Quality report
- Number of evaluations
- Number of failures
- Zero scores

You can switch between monthly, weekly, or daily views, with automatic adjustment to avoid overloading the screen with unnecessary information.
Group view: Consolidated by supervisors with comparisons of quality index, failures, and other data.
⚠️ Failure Report
This report allows for an in-depth analysis of recorded failures, with details by type and impact.
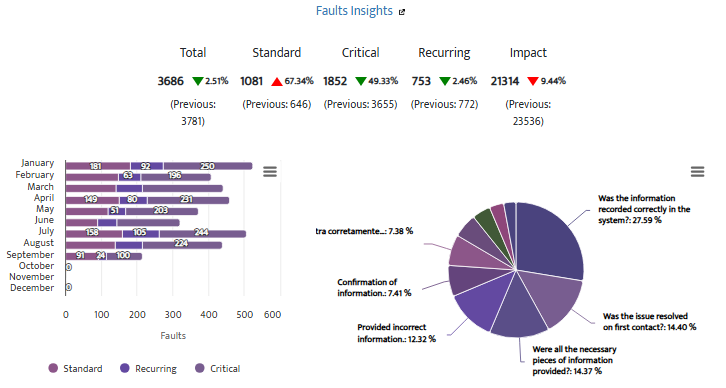
Types of failures:
- Normal: Regular weight.
- Critical: Zeroes the evaluation score.
- Recurring: When an agent fails 2 or more times on the same item.
Report highlights:
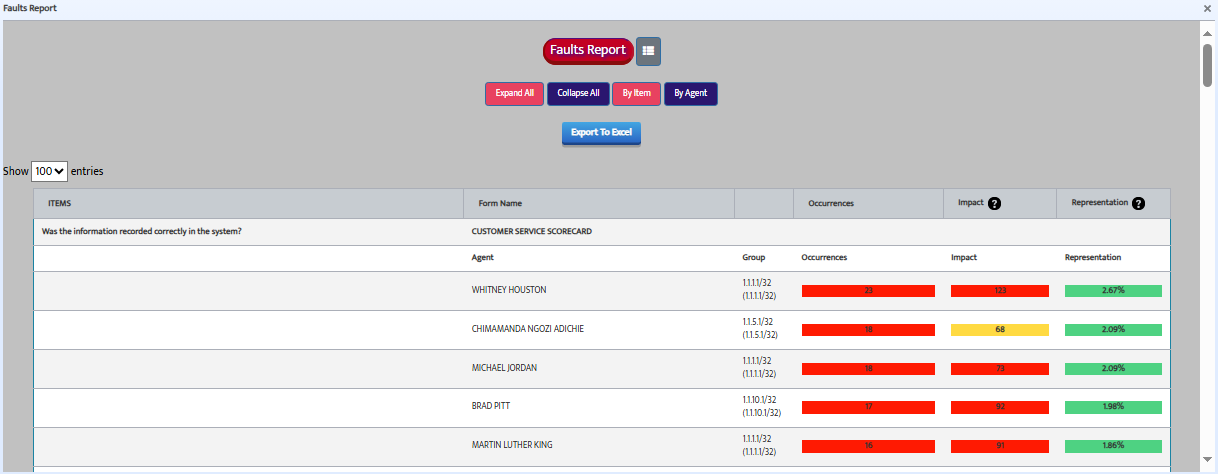
- Total failures per period.
- Impact percentage of each item.
- Critical failure items are highlighted with alert icons and red color.
- Option to view failures by item or by agent.
- You can expand items to see which agents fail most in each, or view by agent and their main errors.
🏆 Ranking – Top 10 Best and Worst Agents
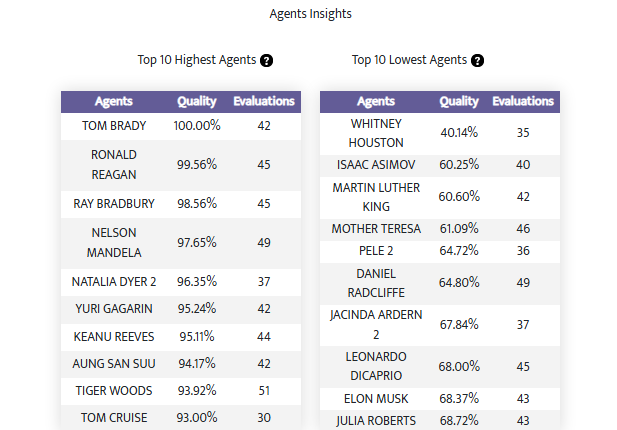
Table highlighting the 10 best and worst agents of the period, considering only those with a number of evaluations equal to or above the operation’s average, avoiding distortion from isolated evaluations.
- Displays: name, number of evaluations, quality average.
- Shows real results, allowing performance recognition and data-driven decision-making.
If you have any questions, feel free to contact us through our support: support@cyf.com