Evaluations Report
This article provides a detailed overview of the structure and functionalities of the Evaluation Report in the CYF Quality. Through this report, it is possible to view and analyze the performance of evaluations carried out, signed and unsigned feedback, disputes, and other important indicators.
To access the report:
- Log into the system: http://cyf.com
- Navigate to the “Evaluations” menu
- Select the “Evaluation Report” option

Available Filters
General Filters allow users to customize how data is displayed by selecting specific criteria such as time period, evaluation date, contact channels, and other parameters. These filters make the analysis more precise and efficient, helping to focus on relevant information for different monitoring and management needs. See the image below for an example:
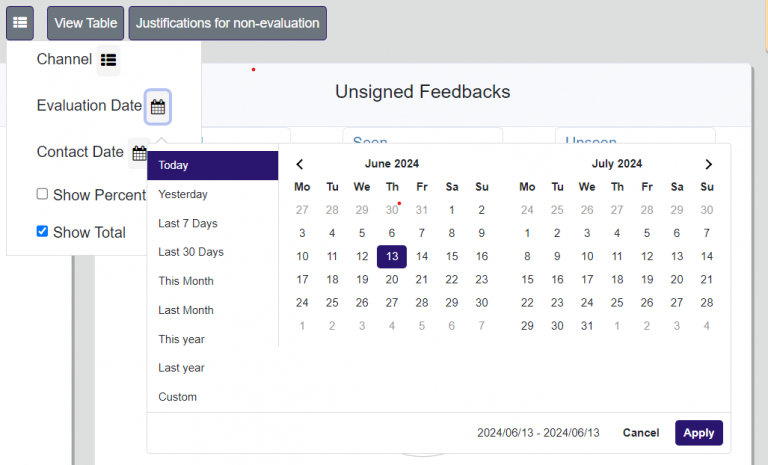
- Period: Allows the selection of specific time ranges for analysis, such as “Today,” “Last 7 days,” “This month,” “Last year,” among others.
- Evaluation Date: Refers to the date on which the evaluation was actually performed, providing context on when the evaluation process occurred.
- Contact Date: Indicates the date the contact with the client or agent was made, which may differ from the evaluation date if the evaluation was conducted later.
- Channels: Filters evaluations by the communication channel used, such as “Call,” “Chat,” “Email,” or “In Person.” Users can select one or all channels for analysis.
- Show Totals / Show Percentages: Switches between displaying data as absolute totals or percentages to facilitate comparative analysis.
- Table View: Offers direct access to the data table, allowing for a more detailed and granular analysis.
- Non-Evaluation Justifications: Redirects to a page listing the reasons why evaluations were not carried out, helping to understand the causes of non-evaluations.
Consolidate All Operations Filter
To use this filter, follow the steps below:
- Click the filter icon in the Evaluation Report
- Filter by Evaluation Date
- Select the “Consolidate All Operations” filter
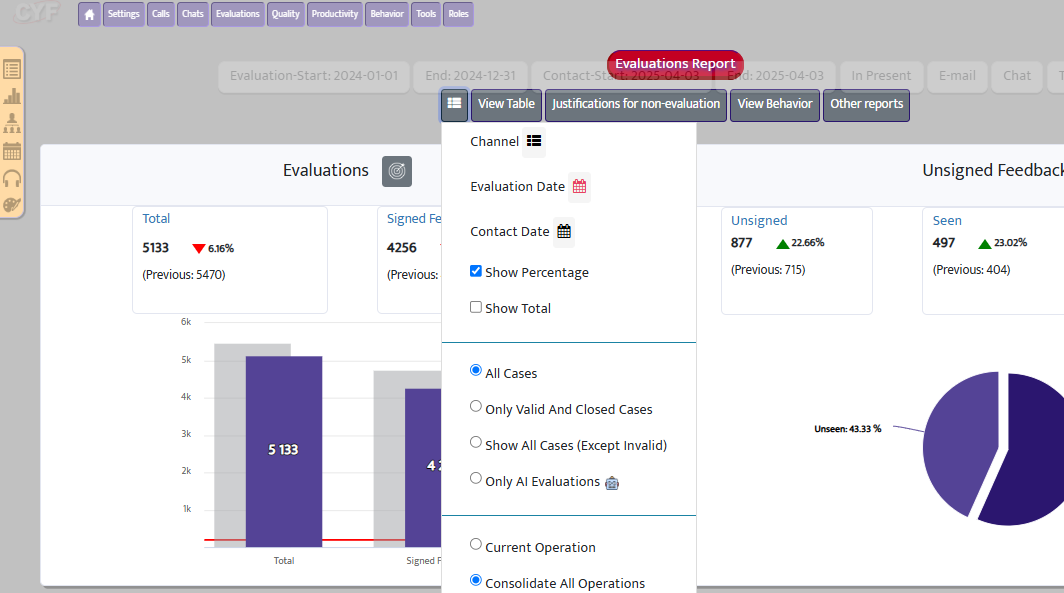
You will now be able to view consolidated data from all operations in the report.
Evaluation Limit for Performance Improvement
When the “Consolidate All Operations” filter is active, the report will display a maximum of 100,000 evaluations.
This restriction was applied to prevent slowdowns and enhance user experience.
Filter to Identify Evaluated Operation
To find out in which operation an agent was evaluated, follow these steps to add the filter to the report. When activated, this filter adds a column showing the operation in which the agent was evaluated.
How to activate the filter:
- In the Evaluation Report, where the agents’ names are displayed
- Click the filter icon
- Select the “Operation” option
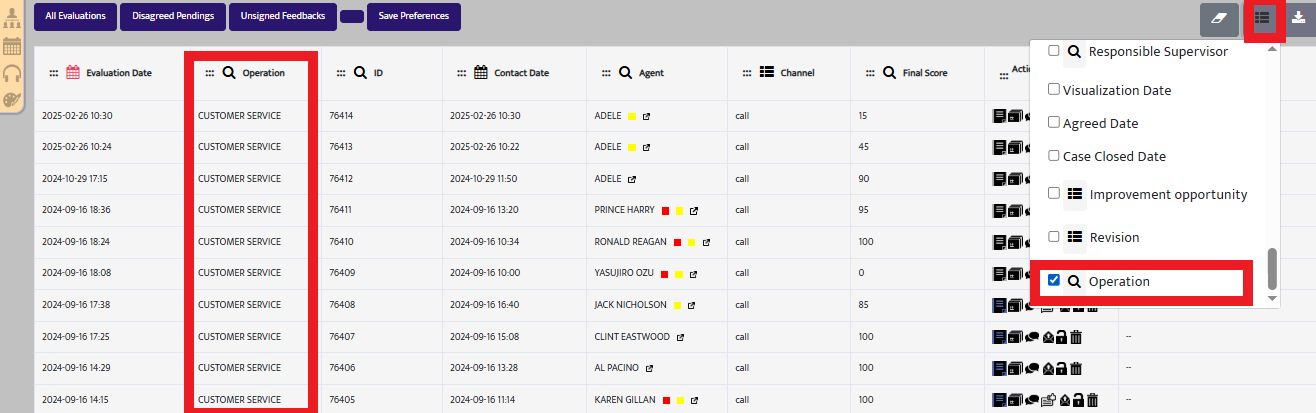
The report will automatically filter and show which operation the agent was evaluated in, as illustrated in the image above.
Charts and KPIs
The CYF Quality report charts and KPIs make it easier to visualize and analyze evaluation data. They help identify trends, measure performance, monitor goals, and make strategic decisions quickly and effectively. This section explains the main indicators and charts available in the system.
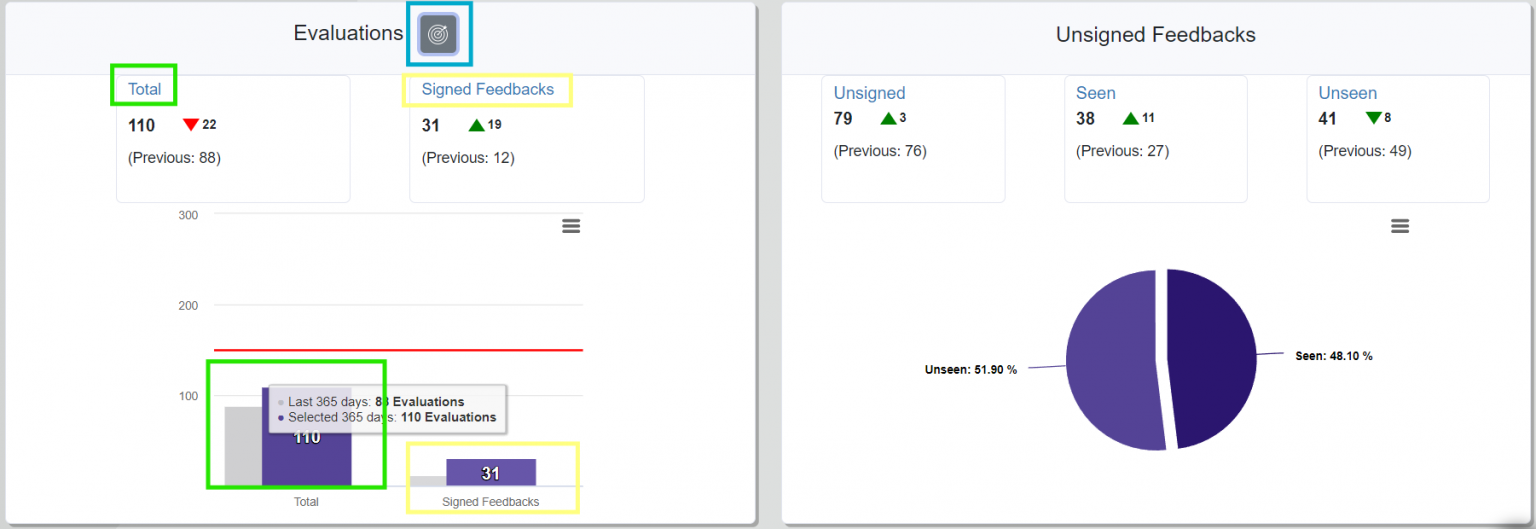
After selecting a period, the chart will populate with relevant data, as shown in the image below.

Blue Box (Top): This is where you can set your goal for evaluations. The goal is defined here, but users must first set monitor-specific goals for the month. This can be done by clicking the displayed link, which redirects to the “Productivity Report,” where goals can be defined per monitor/supervisor. The system then calculates the monthly goal automatically.
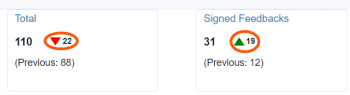
Green Box: Displays the total number of evaluations completed during the selected period.
Yellow Box: Shows the total number of signed feedbacks for the selected period.
The same information regarding “Totals” and “Signed Feedbacks” is displayed on the chart with more details when you hover over a bar.
Evaluations
The Evaluations section in the CYF Quality report presents the main indicators related to the volume and effectiveness of evaluations conducted. This data helps track goal achievement, agent engagement, and the quality of the evaluation process. Below is a summary of the key topics:
Defined Goal: Individually established for each monitor in the Productivity Report. Serves as a benchmark to assess expected monthly performance.
Total Evaluations: Total number of evaluations completed in the selected period. Reflects the workload handled by the evaluation team.
Signed Feedbacks: Shows how many feedbacks have been viewed and signed by agents, indicating their engagement with the evaluations received.
Bar Chart: Visually represents the total evaluations by period and by channel (e.g., phone, chat, email), facilitating category comparison and pattern identification.
Unsigned Feedbacks
The Unsigned Feedbacks section shows whether agents are viewing the feedbacks they receive. The Viewed and Not Viewed indicators help measure engagement and identify opportunities for improving communication and team development.
Interactivity: Clicking on “Viewed” or “Signed Feedbacks” automatically filters the table accordingly.
Disagreements
The Disagreements Chart visually presents key data related to disagreements recorded in evaluations. It helps identify the most disputed items, monitors with the highest dispute volumes, and the classification of those occurrences (valid, invalid, or pending). This analysis is essential for ensuring transparency in the evaluation process and promoting necessary adjustments.
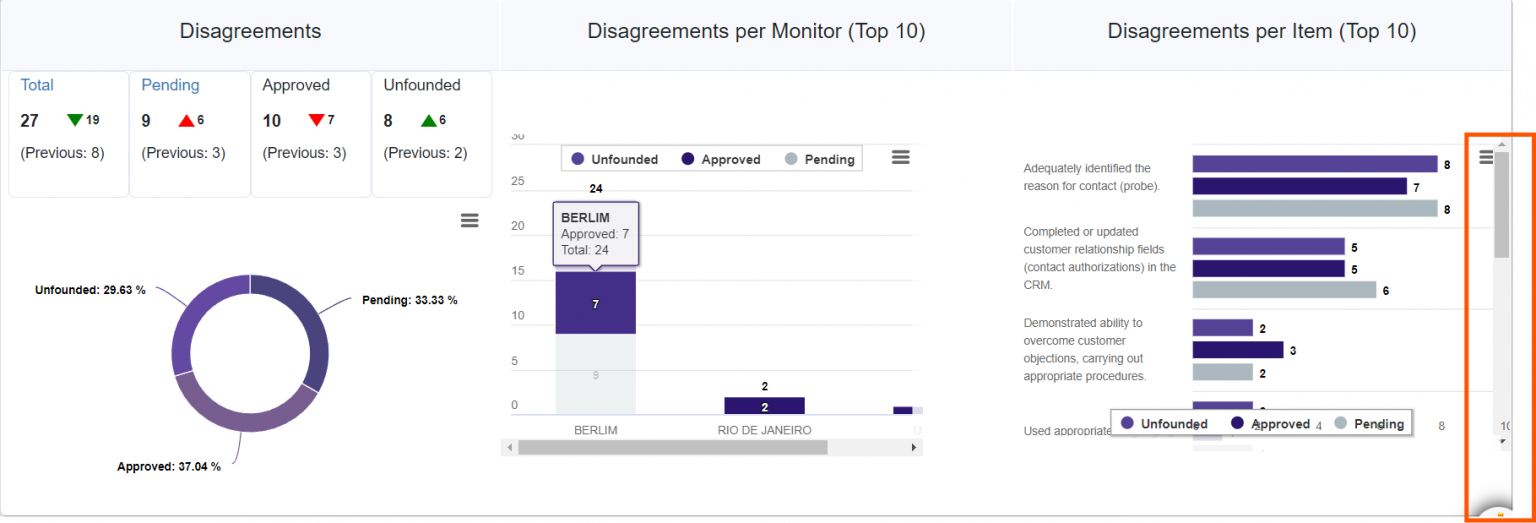
Statuses:
- Total – Shows the total number of disputes in the selected period
- Valid – Number of feedbacks where the contestation was accepted
- Approved – Total number of approved feedbacks
- Unfounded– Number of unjustified or rejected disputes
Donut Chart: Displays detailed information by category (see image above).
Right Side – Top 10:
- Top 10 Disputes by Monitor: Shows monitors with the most disputes, broken down into valid, invalid, and pending.
- Top 10 Disputes by Item: Lists the most disputed evaluation criteria, with the option to scroll to see more items.
Dynamic Table
The Dynamic Table enables detailed and flexible analysis of evaluation data. It allows users to filter, organize, and customize information according to their specific needs, providing a clearer and more objective view of results. This tool makes it easier to visualize specific metrics and generate personalized reports.

Features:
- Default Tab: Displays all recorded evaluations, providing a comprehensive view of the data.
- “Pending Disputes” Tab: Focuses on disputes that remain unresolved during the selected period.
- “Unsigned Feedbacks” Tab: Shows feedbacks that haven’t yet been signed by agents, helping to monitor evaluation engagement.
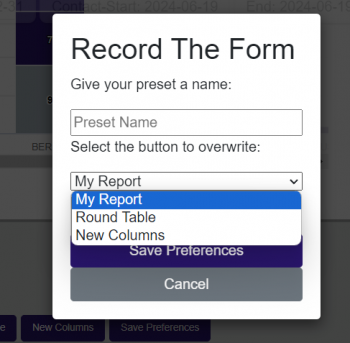
- My Report: Allows users to create and view a personalized report, tailored to their specific needs.
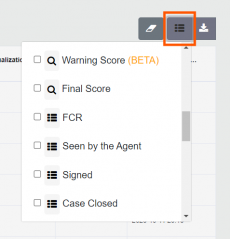
- Add/Remove Columns: The filter icon lets you include or exclude columns in the table, customizing the view as needed.
- Search for Specific Values: Use the < or > operators to filter by percentages, helping locate data that meets specific conditions.
- Save Preferences: Allows users to save their customized view settings by clicking the “Save Preferences” button.
Show Totals / Percentages: Toggle between total numbers or percentages in the chart, providing different perspectives for analysis.
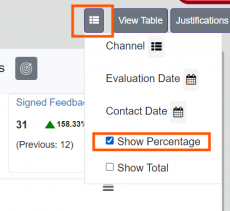
Additionally, users can add or remove columns by clicking on the filter icon.
If you have any further questions about this article, please contact us at support@cyf.com.